
In machine learning, Classification is used to split data into categories. But after cleaning and preprocessing the data and training our model, how do we know if our classification model performs well? That is where a confusion matrix comes into the picture.
A confusion matrix is used to measure the performance of a classifier in depth. In this simple guide to Confusion Matrix, we will get to understand and learn confusion matrices better.
Learn AI and Grab the Best Opportunities Out There
With Purdue University's AI ProgramJoin The ProgramWhat Are Confusion Matrices, and Why Do We Need Them?
Classification Models have multiple categorical outputs. Most error measures will calculate the total error in our model, but we cannot find individual instances of errors in our model. The model might misclassify some categories more than others, but we cannot see this using a standard accuracy measure.
Furthermore, suppose there is a significant class imbalance in the given data. In that case, i.e., a class has more instances of data than the other classes, a model might predict the majority class for all cases and have a high accuracy score; when it is not predicting the minority classes. This is where confusion matrices are useful.
A confusion matrix presents a table layout of the different outcomes of the prediction and results of a classification problem and helps visualize its outcomes.
It plots a table of all the predicted and actual values of a classifier.
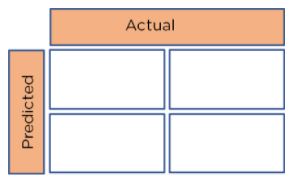
Figure 1: Basic layout of a Confusion Matrix
How to Create a 2x2 Confusion Matrix?
We can obtain four different combinations from the predicted and actual values of a classifier:
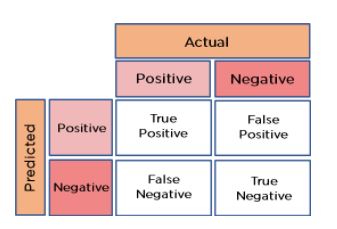
Figure 2: Confusion Matrix
- True Positive: The number of times our actual positive values are equal to the predicted positive. You predicted a positive value, and it is correct.
- False Positive: The number of times our model wrongly predicts negative values as positives. You predicted a negative value, and it is actually positive.
- True Negative: The number of times our actual negative values are equal to predicted negative values. You predicted a negative value, and it is actually negative.
- False Negative: The number of times our model wrongly predicts negative values as positives. You predicted a negative value, and it is actually positive.
Confusion Matrix Metrics
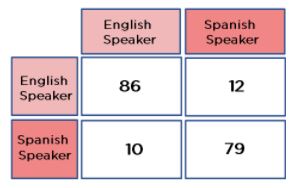
Figure 3: Confusion Matrix for a classifier
Consider a confusion matrix made for a classifier that classifies people based on whether they speak English or Spanish.
From the above diagram, we can see that:
True Positives (TP) = 86
True Negatives (TN) = 79
False Positives (FP) = 12
False Negatives (FN) = 10
Just from looking at the matrix, the performance of our model is not very clear. To find how accurate our model is, we use the following metrics:
- Accuracy: The accuracy is used to find the portion of correctly classified values. It tells us how often our classifier is right. It is the sum of all true values divided by total values.
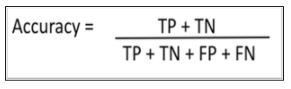
Figure 4: Accuracy
In this case:
Accuracy = (86 +79) / (86 + 79 + 12 + 10) = 0.8823 = 88.23%
- Precision: Precision is used to calculate the model's ability to classify positive values correctly. It is the true positives divided by the total number of predicted positive values.
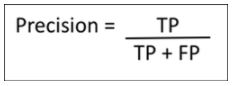
Figure 5: Precision
In this case,
Precision = 86 / (86 + 12) = 0.8775 = 87.75%
- Recall: It is used to calculate the model's ability to predict positive values. "How often does the model predict the correct positive values?". It is the true positives divided by the total number of actual positive values.
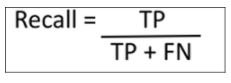
Figure 6: Recall
In this case,
Recall = 86 / (86 + 10) = 0.8983 = 89.83%
- F1-Score: It is the harmonic mean of Recall and Precision. It is useful when you need to take both Precision and Recall into account.
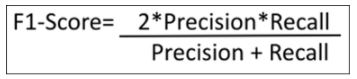
Figure 7: F1-Score
In this case,
F1-Score = (2* 0.8775 * 0.8983) / (0.8775 + 0.8983) = 0.8877 = 88.77%
Scaling a Confusion Matrix
To scale a confusion matrix, increase the number of rows and columns. All the True Positives will be along the diagonal. The other values will be False Positives or False Negatives.
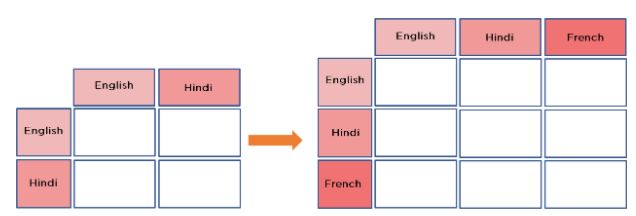
Figure 12: Scaling down our dataset
Now that we understand what a confusion matrix is and its inner working, let's explore how we find the accuracy of a model with a hands-on demo on confusion matrix with Python.
Learn AI and Grab the Best Opportunities Out There
With Purdue University's AI ProgramJoin The ProgramConfusion Matrix With Python
We'll build a logistic regression model using a heart attack dataset to predict if a patient is at risk of a heart attack.
Depicted below is the dataset that we'll be using for this demonstration.
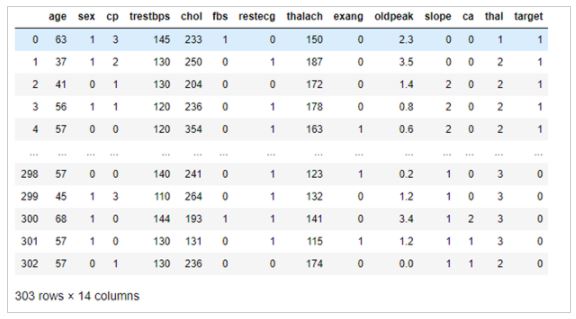
Figure 9: Heart Attack Dataset
Let’s import the necessary libraries to create our model. 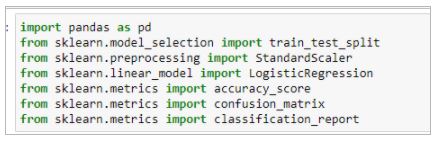
Figure 10: Importing Confusion Matrix in python
We can import the confusion matrix function from sklearn.metrics. Let’s split our dataset into the input features and target output dataset.
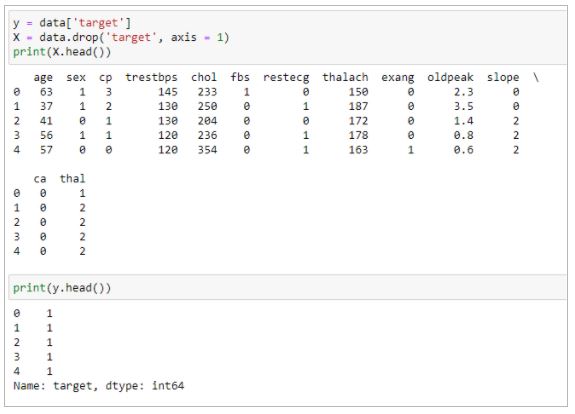
Figure 11: Splitting data into variables and target dataset
As we can see, our data contains a massive range of values, some are single digits, and some have three numbers. To make our calculations more straightforward, we will scale our data and reduce it to a small range of values using the Standard Scaler.
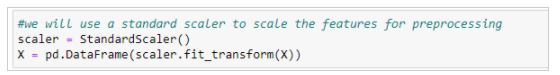
Figure 12: Scaling down our dataset
Now, let's split our dataset into two: one to train our model and another to test our model. To do this, we use train_test_split imported from sklearn. Using a Logistic Regression Model, we will perform Classification on our train data and predict our test data to check the accuracy.
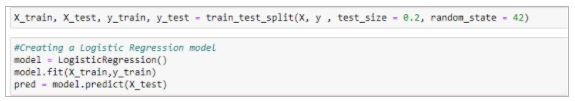
Figure 13: Performing classification
To find the accuracy of a confusion matrix and all other metrics, we can import accuracy_score and classification_report from the same library.
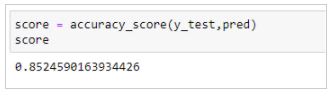
Figure 14: Accuracy of classifier
The accuracy_score gives us the accuracy of our classifier
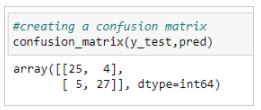
Figure 15: Confusion Matrix for data
Using the predicted values(pred) and our actual values(y_test), we can create a confusion matrix with the confusion_matrix function.
Then, using the ravel() method of our confusion_matrix function, we can get the True Positive, True Negative, False Positive, and False Negative values.
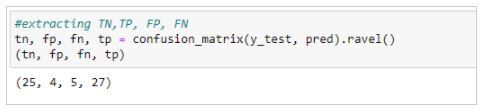
Figure 16: Extracting matrix value
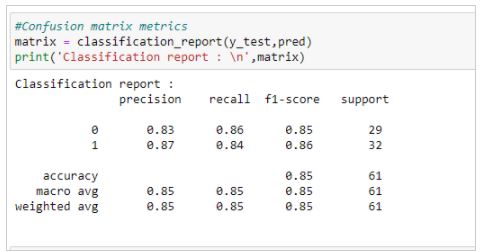
Figure 17: Confusion Matrix Metrics
Finally, using the classification_report, we can find the values of various metrics of our confusion matrix.
Looking forward to making a move to the programming field? Take up the Post Graduate Program in AI and Machine Learning and begin your career as a professional Python programmer
Learn the Latest Advancements in the AI Space
With the Latest Gen AI and Machine Learning CourseExplore TodayConclusion
In this article - The Best Guide to Confusion Matrix, we have looked at what a confusion matrix is and why we use confusion matrices. We then looked at how to create a 2X2 confusion matrix and calculate the confusion matrix metrics using it. We took a look at how confusion matrices can be scaled up to include more than two classification classes and finally got hands-on experience with confusion matrices by implementing them in Python.
Was this article on the confusion matrix useful to you? Do you have any doubts or questions for us? Mention them in this article's comments section, and we'll have our experts answer them for you at the earliest!