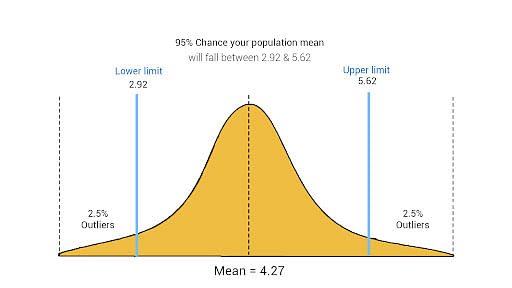
A confidence interval is a type of interval calculation in statistics derived from observed data and holds the actual value of an unknown parameter. It's linked to the confidence level, which measures how confident the interval is in estimating the deterministic parameter.
What Is Confidence Interval?
A confidence interval shows the probability that a parameter will fall between a pair of values around the mean. Confidence intervals show the degree of uncertainty or certainty in a sampling method. They are constructed using confidence levels of 95% or 99%.

When Do You Use Confidence Intervals?
The size of a 90% confidence interval for a given estimate is one method to gauge how "excellent" it is; the greater the range, the more care must be used when utilising the estimate. Confidence intervals serve as a crucial reminder of the estimates' limits.
What Does a 95% Confidence Interval Mean?
The 95% confidence interval is the range that you can be 95% confident that the similarly constructed intervals will contain the parameter being estimated. The sample mean (center of the CI) will vary from sample to sample because of natural sampling variability.
Statisticians use confidence intervals to measure the uncertainty in a sample variable. The confidence is in the method, not in a particular CI. Approximately 95% of the intervals constructed would capture the true population mean if the sampling method was repeated many times.
Confidence Interval Formula
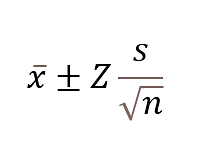
The formula to find Confidence Interval is:

- X bar is the sample mean.
- Z is the number of standard deviations from the sample mean.
- S is the standard deviation in the sample.
- n is the size of the sample.
The value after the ± symbol is known as the margin of error.
Question: In a tree, there are hundreds of mangoes. You randomly choose 40 mangoes with a mean of 80 and a standard deviation of 4.3. Determine that the mangoes are big enough.
Solution:
Mean = 80
Standard deviation = 4.3
Number of observations = 40
Take the confidence level as 95%. Therefore the value of Z = 1.9
Substituting the value in the formula, we get
= 80 ± 1.960 × [ 4.3 / √40 ]
= 80 ± 1.960 × [ 4.3 / 6.32]
= 80 ± 1.960 × 0.6803
= 80 ± 1.33
The margin of error is 1.33
All the hundreds of mangoes are likely to be in the range of 78.67 and 81.33.
Calculating A Confidence Interval
Imagine a group of researchers who are trying to decide whether or not the oranges produced on a certain farm are large enough to be sold to a potential grocery chain. This will serve as an example of how to compute a confidence interval.
Step 1: Determine the sample size (n).
46 oranges are chosen at random by the researchers from farm trees.
Consequently, n is 46.
Step 2: Determine the samples' means (x).
The researchers next determine the sample's mean weight, which comes out to be 86 grammes.
X = 86.
Step 3: Determine the standard deviation (s).
Although utilising the population-wide standard deviation is ideal, this data is frequently unavailable to researchers. In this scenario, the
If this is the case, the researchers should apply the sample's determined standard deviation.
Let's assume, for our example, that the researchers have chosen to compute the standard deviation from their sample. They get a 6.2-gramme standard deviation.
S = 6.2.
Step 4: Determine the confidence interval utilised in step #4.
In ordinary market research studies, 95% and 999% are the most popular selection for confidence intervals.
For this example, let's assume that the researchers employ a 95 per cent confidence interval.
Step 5: Find the Z value for the chosen confidence interval in step #5.
The researchers would subsequently use the following table to establish their Z value:
Confidence Interval Z
80% 1.282
85% 1.440
90% 1.645
95% 1.960
99% 2.576
99.5% 2.807
99.9% 3.291
Step 6: Calculate the following formula
The next step would be for the researchers to enter their known values into the formula. Following our example, this formula would look like this:
86 ± 1.960 (6.2/6.782)
This calculation yields a value of 86 1.79, which the researchers use as their confidence interval.
Step 7: Come to a decision.
According to the study's findings, the real mean of the larger population of oranges is probably (with a 95% confidence level) between 84.21 grammes and 87.79 grammes.
The Z-Value
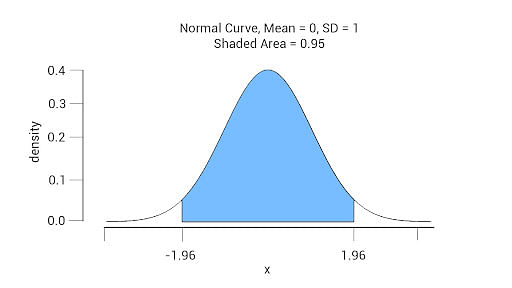
Z is the number of standard deviations from the sample mean (1.96 for 95% confidence, 2.576 for 99%). Z-scores can be positive or negative. The sign tells you whether the observation is above or below the mean. For example, a z-score of +1 shows that the data point falls one standard deviation above the mean, while a -1 signifies it is one standard deviation below the mean. A z-score of zero equals the mean.
How Are Confidence Intervals Used?
Statisticians use confidence intervals to measure the uncertainty in a sample variable. For instance, a researcher may randomly select different samples from the same population and compute a confidence interval for each sample to determine how well it represents the actual value of the population variable. The resulting datasets are all different, with some intervals included and others not including the true population parameter.

What Is a T-Test?
Statistical methods such as the T-Test are used to calculate confidence intervals. A t-test is an inferential statistic used to observe a significant difference in the average of two groups that could be linked to specific characteristics. Three fundamental data values are required to calculate a t-test. They include the mean difference (the difference between the mean values in each data set), the standard deviation of each group, and the data points in each group.
Mean Of Normally-Distributed Data
A normal distribution's mean and standard deviation are 0 and 1, respectively. It has a kurtosis of 3 and zero skew.
Confidence Interval For Proportions
In newspaper stories during election years, confidence intervals are expressed as proportions or percentages. For instance, a survey for a specific presidential contender may indicate that they are within three percentage points of 40% of the vote (if the sample is large enough). The pollsters would be 95% certain that the actual percentage of voters who supported the candidate would be between 37% and 43% because election polls are frequently computed with a 95% confidence level.
Stock market investors are most interested in knowing the actual percentage of equities that rise and fall each week. The percentage of American households with personal computers is relevant to companies selling computers. Confidence intervals may be established for the weekly percentage change in stock prices and the percentage of American homes with personal computers.
Confidence Interval For Non-Normally Distributed Data
In data analysis, calculating the confidence interval is a typical step that may be easily derived from populations with normally distributed data using the well-known x (ts)/n formula. The confidence interval, however, is not always easy to determine when working with data that is not regularly distributed. There are fewer and far less easily available references for this data in the literature.
We explain the percentile, bias-corrected, and expedited versions of the bootstrap method for calculating confidence intervals in plain terms. This approach is suitable for both normal and non-normal data sets and may be used to calculate a broad range of metrics, including mean, median, the slope of a calibration curve, etc. As a practical example, the bootstrap method determines the confidence interval around the median level of cocaine in femoral blood.
Reporting Confidence Intervals
We always present confidence intervals in the manner shown below:
95% CI [LL, UL]
LL: Lower limit of the confidence interval,
UL: Upper confidence interval limit
The practice of reporting confidence intervals for various statistical tests is demonstrated in the examples below.
Example 1: Mean Confidence Interval
Let's say a scientist is interested in learning the average weight of a certain turtle species.
She weighs 25 turtles at random and determines that the mean weight of the sample is 300 pounds, with a 95% confidence interval of [292.75 pounds, 307.25 pounds].
She may report the findings as follows:
According to a formal study, this population's turtles weigh an average of 300 pounds, 95% confidence interval [292.75, 307.25].
Example 2: The Confidence Interval for the Means Difference
Let's say a scientist wishes to calculate the variation in mean weight between two turtle populations.
The mean difference, with a 90% confidence range of [-3.07 pounds, 23.07 pounds], is 10 pounds after she gathers data for both turtle populations.
She may report the findings as follows:
According to formal research, there is an average weight difference of 10 pounds, 90% CI [-3.07, 23.07], between the two groups of turtles.
Caution When Using Confidence Intervals
The 'actual value' of your estimate may reside inside the confidence interval, according to various interpretations of confidence intervals. That is not the situation. Because the confidence interval is based on a sample rather than the entire population, it cannot tell you how probable it is that you discovered the real value of your statistical estimate. Only if you repeat your sampling or conduct your experiment, in the same manner will it be able to tell you what range of numbers you anticipate finding.
Misconception About Confidence Intervals
Since a confidence interval is not a probability, it is incorrect to state that there is a 95% chance that a particular 95% confidence interval will include the actual value of the estimated parameter.
How Do You Interpret P-Values And Confidence Intervals?
Statistical tests are used in confirmatory (evidential) research to determine whether null hypotheses should be accepted or rejected. The outcome of such a statistical test is the p-value, which is a probability. This probability indicates the strength of the evidence against the null hypothesis. Strong evidence is correlated with low p-values. The results are deemed "statistically significant" if the p-value falls below a certain threshold.
Confidence Interval Example
If you compute a 95% confidence interval all around mean proportion of female infants born each year using a random sample of newborns, you may find an upper bound of 0.56 and a lower bound of 0.48. The confidence interval's upper and lower limits are presented below. The level of confidence is 95%.
Conclusion
In this confidence interval in statistics tutorial, you have learned the importance of confidence intervals and the formula to calculate the same. The confidence interval tells you the range of values you can expect if you re-do the experiment in the same way.
If you are looking to pursue this further and make a career as a Data Analyst, Simplilearn’s Data Analytics Certification Program in partnership with Purdue University & in collaboration with IBM is the program for you.
Was this tutorial on Confidence Interval In Statistics helpful to you? If you have any doubts or questions, please mention them in this article's comments section, and we'll have our experts answer them for you at the earliest!

