Is your slow web page the cause of not attracting enough traffic? How do you figure out the reason for that? Google takes notice of slow web pages and those that are faster and provide a better user experience. The better the user experience, the more traffic Google allows to your website. From the viewpoint of both the users and keyword rankings, the answer of the first two questions is the PSI - Google PageSpeed Insights.
What Is Google PageSpeed Insights?
Google PageSpeed Insights, Webpage Test, and Website Speed Test are always the preferred tools for running speed tests. What makes PageSpeed Insights different from others is that it empowers you to make decisions to enhance your website’s performance. The recommendations by the Google page speed test are based on latest industries’ best practices for mobile and desktop web performance.
Advanced data visualization, filtering, tagging, and snapshot technology in the Google PageSpeed Insights assist in providing a comprehensive solution to increase website’s search engine ranking, amplify its performance, and boost users’ browning experience.
Google Page Speed Test Metrics - Insights and Rankings
The score provided by the Google page speed test is not an official ranking factor because it’s just a tool that helps you with web page issues. It is meant to be a prominent metric of performance. It’s just a tool to help users find issues whose scores are based on the part of Google’s ranking algorithms, i.e., Core Web Vitals.
PSI scores indicate whether your pages meet Google’s performance and speed standards or not. The higher the score, the better the keyword rankings will be. If you do not find the solutions for the webpage’s slow speed, any SEO strategy will not work to improve the performance of web pages.
How to Use Google PageSpeed?
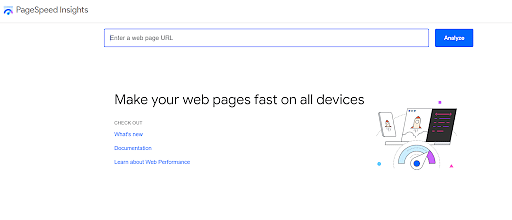
1. To perform the Google page speed test, enter the desired URL on the PageSpeed Insights website.

2. Press Analyze and let PSI do its analysis.
3. While the report is generated, the tool does two things:
-
- First, it gathers ‘field data’ of the web page in the CrUX, i.e., the Chrome User Experience report.
- Then it measures the page performance using the Lighthouse API. It computes the loading rate in a controlled and simulated environment: mid-tier devices and mobile networks. Hence, this is referred to as ‘Lab Data.’
4. After checking the report, eliminate variables that hinder the speed and pull down the rankings.
Google PageSpeed Insight Test Report Breakdown
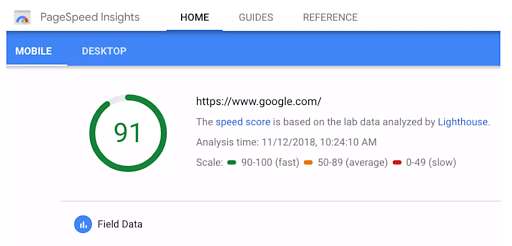
The detailed PSI report contains lab data, field data, opportunities, diagnostics, and passed audits. The colored coding throughout the report makes it easier to locate the areas that are performing well on the website, where it needs improvement, and where it is underperforming.
- Red indicates poor performance
- Green means good/acceptable performance
- Yellow shows how much improvement it needs

A report from Google Page Speed Test Report
Field Data
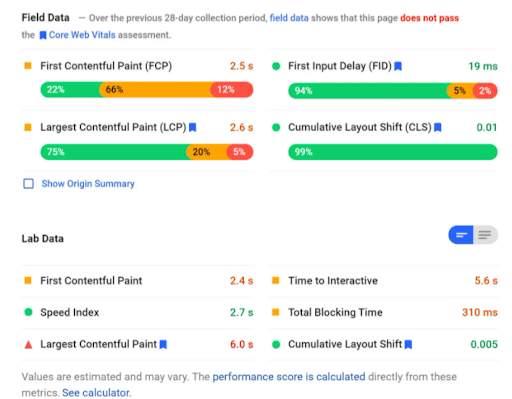
The previous 28 days report is shown in the Google PageSpeed Insights field data. It is always represented with accompanying distribution bars as it is made up of aggregated data from the CrUX report, and no web page performs the same for users.
The four metrics of the field data capture different aspects of load and speed time. Each of them is measured in milliseconds or seconds, except CLS.
- FCP: First Contentful Paint is the time taken for the first image or text to load.
- LCP: Largest Contentful Paint is the time taken for the largest image or text to load.
- FID: First Input Delay is the time taken for the browser to answer the user's first interaction.
- CLS: Any page movement in the viewport is measured by Cumulative Layout Shift; CLS score below 0.1 is good, and above 0.25 is poor.
Lab Data
It includes data and information from the Lighthouse API, which measures FCP, CLS, LCP, time to interactive, speed index, and total blocking time. The speed index is the time for the image/text to appear during page load visually. Total blocking time is the total time between full interactivity and FCP. Time to interactive is the time for the page to become fully interactive.

A Lab Data Report
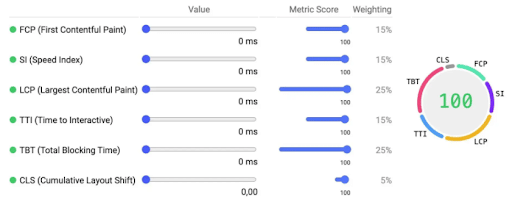
Google PageSpeed Insights lab data does not have a progress bar. It simply has time stamps and generated reports from the lab test. The weightage of these metrics is given below in the table.
Audit |
Weight |
|
FCP |
10% |
|
Speed index |
10% |
|
LCP |
25% |
|
Time to interactive |
10% |
|
Total blocking time |
30% |
|
CLS |
15% |
Opportunities and Diagnostics
The opportunities section of the Google page speed test report provides specific recommendations for magnifying web page speed. After the opportunity report is generated, this tool will provide info for the customizations of your content management system once you click the dropdown to see detailed insights about the next steps.
More the same way, the diagnostics section showcases the best practices for the application’s performance. After clicking on the dropdown of each practice, you will get to know the root cause of the issue.
Passed Audits
If you want to check what the page is doing, whether or not it is doing right, then look for the passed audits report. If you get a long list, then be happy. The audits have passed through your web page, showing good results.
100/100 in Google Page Speed Test
The score gives you an idea of where your website stands. Though many website makers/owners are obsessed with getting a 100/100 score in the Google PageSpeed Insight; however, it is not that important. Scoring a 100/100 doesn’t assure that your website will rank in SERPs.
Do not overlook the most important aspect of the test results - Recommendations. More than scores, recommendations are crucial. Focusing and working on the latter will enrich your website’s traffic.
- Optimize the images by resizing/compressing them. Insert a particular height and width for it. To deliver your images, use a content delivery network.
- Embed the video rather than uploading them directly to the website, which tends to make it slow.
- Redirects can increase the time to load the first byte; avoid using them.
- Go for a faster website theme, which is lightweight. Use GZIP, a speedy design, to improve PSI scores.
- Do not forget to enable browser caching. It will load the web pages faster the next time a user visits the website.

The Google PageSpeed Insight Score
Conclusively, a good page speed does not infer a 100/100 score and vice versa. The main aim must be to concentrate on making pages extremely fast. After all, your webpage’s speed matters greatly to both Google and users.
20 Google PageSpeed Insights Recommendations
Google PageSpeed Insights and recommendations to improve the performance of your website:
- Remove all render-blocking resources - This refers to JavaScript and CSS scripts that are slowing down your page's loading time.
- Do not chain critical requests - Chaining critical requests are related to how browsers load your pages and Critical Rendering Path (CRP). For example, certain elements, such as the JavaScript and CSS we discussed earlier, must be completely loaded before your page is visible.
- Maintain low request counts and small transfer sizes - The more requests browsers must make to load your pages, and the more resources your server returns in response, the longer it takes for your website to load.
- CSS minification - The process of condensing your files by removing unnecessary characters, spaces, and duplications is known as minifying your CSS.
- Minify JavaScript - Just as you can reduce the size of CSS files by minifying them, you can do the same with JavaScript files.
- Discard unused CSS - Any code in your stylesheet is content that must be loaded before users can view your page. If you have CSS on your site that isn't actually useful, it's causing a performance drain.
- Reduce main-thread work - The main thread cannot handle user requests when processing your site's code. If the main-thread work of your site takes longer, it can lead to a poor user experience.
- Minimize JavaScript execution time - Insights have a separate recommendation that will notify you if JavaScript execution is having a significant impact on the performance of your site.
- Shorten server response times (TTFB) - Time to First Byte (TTFB) is a metric that measures how long it takes for a browser to receive the first byte of data back from your site's server after making a request. As a result, one of Google PageSpeed Insights' recommendations is to reduce server response times.
- Image dimensions - Media files, such as images can be properly sized to reduce loading times.
- Postpone offscreen images - Instead of loading every image on a page before displaying the above-the-fold content, the browser will only load those that are immediately visible.
- Image encoding efficiency - One of the most fundamental optimization best practices to consider is compression, which can help reduce file sizes and make them load faster.
- Display images in next-generation formats - Some image file formats are quicker to load than others. Unfortunately, they are not in the common PNG or JPEG formats.
- Use video formats for animated content - In a variety of situations, GIFs can be an effective form of visual content. Walkthrough tutorials, feature reviews, and humorous animations can elevate your posts and make them more enjoyable and valuable to readers.
- Maintain text visibility during webfont load - Fonts, like images, are typically large files that take a long time to load. In some cases, browsers hide your text till the font you are using loads completely.
- Text compression should be enabled - The Enable text compression recommendation from Google PageSpeed Insights refers to the use of GZIP compression.
- Connect to required origins in advance - Using preconnect attributes alerts browsers right away that third-party scripts on your page must be loaded.
- Requests for preload keys - Following this recommendation allows you to reduce the number of requests browsers must make to your site's server.
- Avoid using multiple page redirects - While it's not wrong to use redirects in general, they do add to the loading time.
- Avoid massive network payloads - This recommendation is especially pertinent to your mobile visitors. Large payloads may necessitate the use of more cellular data, which will cost your users money.
Lighthouse vs Pagespeed insights
Google PageSpeed uses both real-world and lab data from the Chrome User Experience report. Google PageSpeed is a tool that analyses your web pages' performance and generates an overall speed report for your website.
Google Lighthouse measures your website's performance using only lab data, but it also considers SEO, PWA, and other best practices. When auditing your website, Lighthouse goes beyond the page speed metric.
Feature |
Google PageSpeed |
Google Lighthouse |
|
Data |
Employs a "combination" of laboratory and real-world data |
Only uses laboratory data |
|
Function |
Only measures performance metrics |
• Examines other aspects of a website (SEO, progressive web app, accessibility, etc.) |
|
When to use |
• You need to share a link to your website's audit report • You only want to check your website's page loading speed • You want an accurate report of the loading times experienced by your website's visitors |
• When you want to run audits programmatically • When you need to evaluate aspects of your website other than loading times • When you want to integrate the Lighthouse API into your own systems |
While Google PageSpeed Insights uses Lighthouse data to enrich it with real-world data, Lighthouse provides you with more than one score. It goes beyond simply measuring the loading times of your website.
FAQs
1. How accurate are Google PageSpeed Insights?
The surprising point is that the Google page speed test score is not truly accurate. They cannot rate a user’s true website experience. However, it does affect SEO. According to Google, page experience plays an important role in ranking. And page speed plays a crucial role in building a good user experience.
2. What’s a good Google page speed test score?
The Google page speed test score ranges from 0 to 100. The higher the score, the better the website’s performance is. A score of more than 85 indicates a user-friendly website and increases the possibility of ranking higher in SERPs.
3. Is Google PageSpeed Insights reliable?
Though Google PageSpeed Insights provides a detailed analyzed report of the webpage’s performance; however, it is not as reliable as other tools present. A few other tools are Sematext, Pingdom Speed Test, Uptrends, GTmetrix, and many others.
If you wish to become a Digital Marketing expert, you should explore and enroll in our world-class digital marketing program, offered by IMT Ghaziabad. You can master all the concepts and tools and techniques of the digital marketing field including, SEO, Social Media, PPC, Web Analytics, & Analytics and so much more. Sign up today!
